Interactive Dashboards
Create dynamic dashboards that bring your key business data into one clear, interactive view.

Extend your team with skilled data visualization experts by offshoring to India. Get dedicated support for visual analytics while your team focuses on what matters most.


Transform scattered data and complex reports into clear, interactive visuals that give your team the insights they need without the spreadsheet maze.


Too many charts make it hard to see what matters.
You know what changed, but not why it changed.
You find issues after they happen instead of seeing them early.
If someone has to explain the dashboard, it is not clear enough.
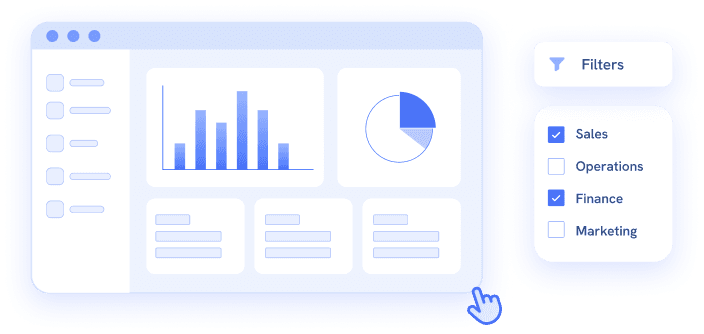
Create dynamic dashboards that bring your key business data into one clear, interactive view.
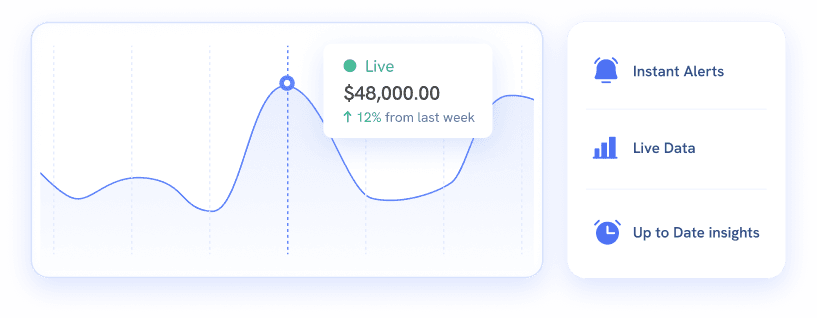
Monitor your business in real time with live data, instant alerts, and up-to-date insights.
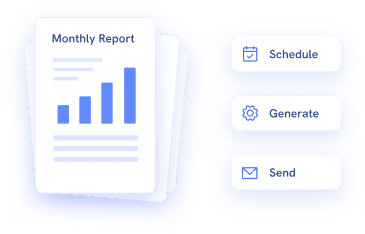
Automate daily, weekly, and monthly reports and deliver them straight to inboxes.
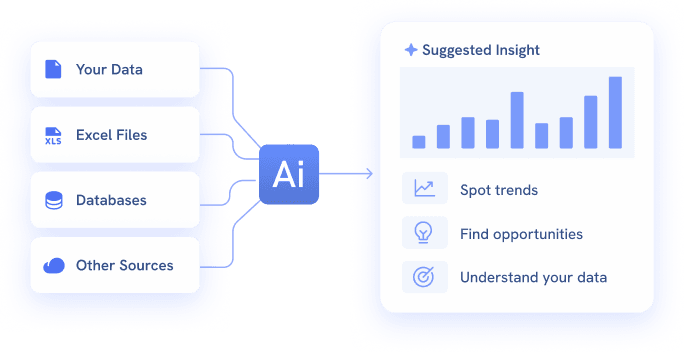
Let AI choose the right charts, find patterns, and make your dashboards better.
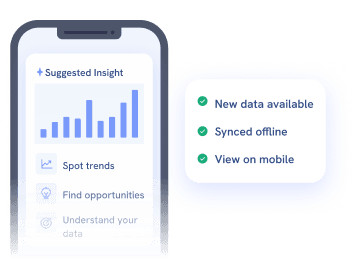
Access responsive dashboards on your phone, with offline viewing and automatic updates.
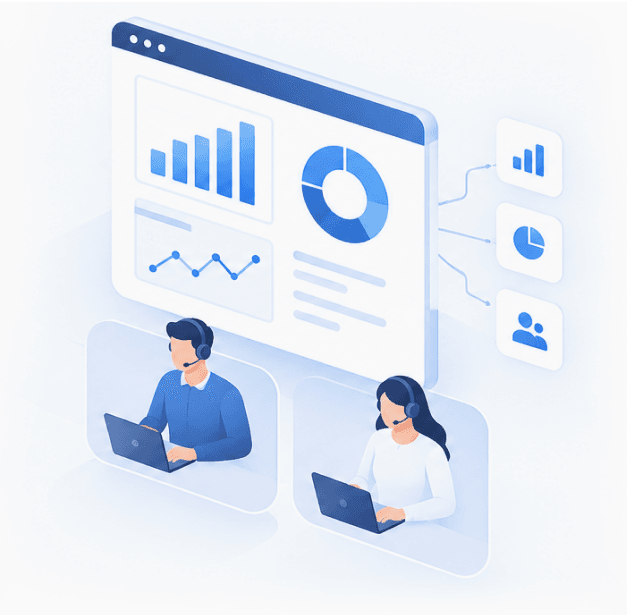
Get expert data visualization support without the cost of building a full in-house team by offshoring to India.

Share a little about your project, and our team will get in touch to discuss your requirements and the best way forward.
Show your plant managers what's actually happening on the floor while the shift is still running.

Give your operations team a live picture of every shipment, route and cost, so delays are caught before the customer calls.

Let your warehouse leads see stock, space and labour in one view instead of chasing numbers across systems.

Give your site workers and managers a role specific view of extraction, equipment and compliance across every location.
Trusted by enterprises across the UAE and beyond.
We understand that handing a third party access to your financial, operational,
and HR data requires trust. Here’s exactly how we protect it.
All data in transit and at rest is AES-256 encrypted. Always.
We build within your existing Microsoft or Tableau environment, no third-party data transfer.
Every engagement begins with a signed mutual NDA before a single data connection is made.
Granular permission layers ensure each person sees only what they're authorised to see.
Your answers are already in your data. They’re just buried across spreadsheets that don’t talk to each other. We bring them into a single view your team can act on.
We create clear, interactive dashboards and visualizations that turn complex data into actionable insights.
Our data visualization consulting helps you choose the right visuals, improve dashboard usability, and communicate insights more effectively.
Yes. We can connect and visualize data from spreadsheets, databases, business tools, and other common data sources.
Absolutely. We design dashboards around your goals, metrics, workflows, and specific reporting needs.
Every metric is reconciled against source systems and formally signed off with your team prior to handover. All definitions are documented, ensuring consistency across departments and reporting views.
Email Address
info@difinitydigital.com
Number
+971 501891421
Assistance hours:
Monday – Friday 9 am to 6 pm
Email Address
info@difinitydigital.com
Number
+971 501891421
Assistance hours:
Monday – Friday 9 am to 6 pm
1st Floor, Carnival Infopark Phase1, Kakkanad, Kochi, Kerala
Kochi Kerala 682030
© Copyright Difinity Digital. All Rights Reserved
Talk to Our Experts
We’ll tell you honestly where we can help, what it would take, and where we’d start.
Successful projects delivered
Service delivery experts
Share your details and our team will reach out within one business day.
Prefer to talk now? Call +91 9995099503
Talk to Our Experts
We’ll tell you honestly where we can help, what it would take, and where we’d start.
Successful projects delivered
Service delivery experts
Share your details and our team will reach out within one business day.
Prefer to talk now? Call +971 04 259 7982