Scroll down

Your Data Already Has the Answers. We Make Them Visible.

Extend your team with skilled data visualization experts by offshoring to India. Get dedicated support for visual analytics while your team focuses on what matters most.

Form image

Start a Conversation

Our Clients

Our Clients

  • G42
  • Al Khaleej Sugar
  • Alliad
  • HLB
  • Kalliyath Group
  • Dentcare
  • Mane Kancor
  • Hubit
  • Skye
  • Harbor
  • Emvees
  • Buchprufer

Your Data Holds the Answer. We Make Them Visible.

Transform scattered data and complex reports into clear, interactive visuals that give your team the insights they need without the spreadsheet maze.

Form image

Start a Conversation

Our Clients

Our Clients

  • G42
  • Al Khaleej Sugar
  • Alliad
  • HLB
  • Kalliyath Group
  • Dentcare
  • Mane Kancor
  • Hubit
  • Skye
  • Harbor
  • Emvees
  • Buchprufer

What our clients achieve in the first 90 days

2.4MRows
Loading in under 3 seconds
28KPIs
Tracked in one place, defined once
12locations
Compared side by side on a single view
99%
Refresh reliability, so nobody double-checks the source

YOUR DATA ISN'T THE PROBLEM. GETTING TO IT IS.

You may have felt all four of these

Too much information

Too many charts make it hard to see what matters.

You see the number, not the reason​

You know what changed, but not why it changed.

Problems show up too late

You find issues after they happen instead of seeing them early.

It needs an explanation

If someone has to explain the dashboard, it is not clear enough.

How we can help

Features Section
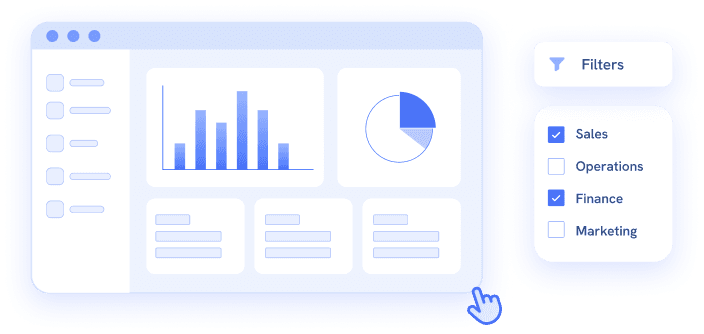
Dashboard with charts and category filters

Interactive Dashboards

Create dynamic dashboards that bring your key business data into one clear, interactive view.

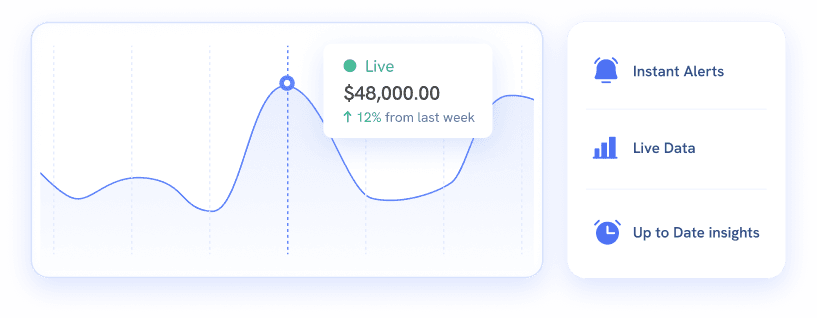
Live revenue line chart with alerts panel

Real-Time Analysis

Monitor your business in real time with live data, instant alerts, and up-to-date insights.
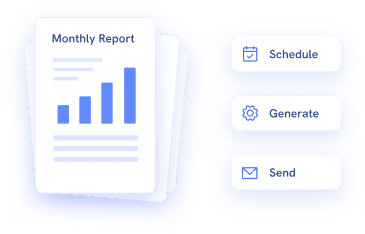
Monthly report with schedule, generate and send actions

Report Automation

Automate daily, weekly, and monthly reports and deliver them straight to inboxes.
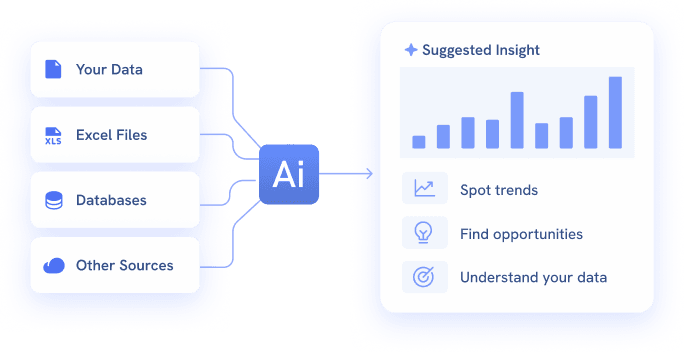
Data sources flowing through AI into a suggested insight

AI-Assisted Data Visualization

Let AI choose the right charts, find patterns, and make your dashboards better.
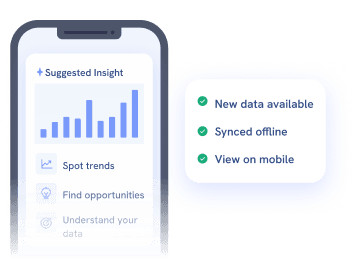
Dashboard on a phone with sync and offline status

Mobile-Friendly Visuals

Access responsive dashboards on your phone, with offline viewing and automatic updates.
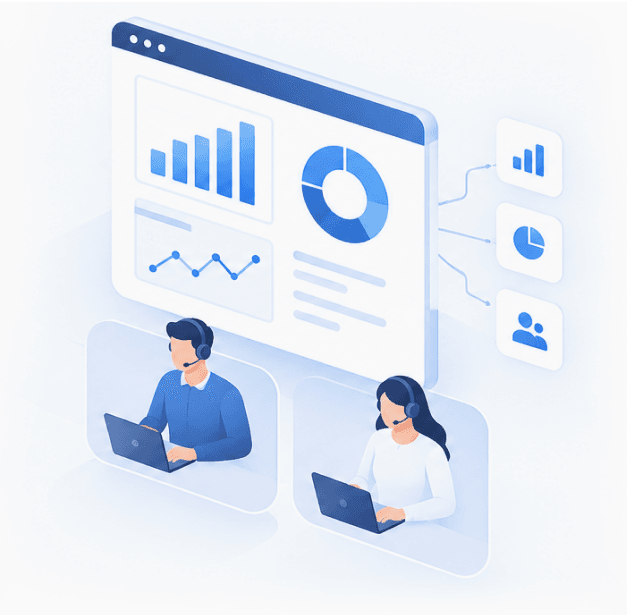
Offshoring Support

Get expert data visualization support without the cost of building a full in-house team by offshoring to India.

Let’s Talk About Your Goals

Let’s Talk About Your Goals

Share a little about your project, and our team will get in touch to discuss your requirements and the best way forward.

Start a Conversation

Our Process

Our Process

CASE STUDIES

Success stories from
businesses like you

Functions
Manufacturing performance dashboard

Show your plant managers what's actually happening on the floor while the shift is still running.

  • Production Output vs Plan by Line
  • Machine Downtime & Root Cause Tracking
  • Overall Equipment Effectiveness (OEE)
  • Scrap, Rework & Quality Defect Trends
  • Raw Material Consumption & Yield
Get Started
Logistics and delivery dashboard

Give your operations team a live picture of every shipment, route and cost, so delays are caught before the customer calls.

  • Fleet Location & Shipment Status
  • On-Time Delivery Performance by Route
  • Cost per Mile & Fuel Consumption
  • Carrier & Vendor Performance Scorecards
  • Delay, Exception & Damage Alerts
Get Started
Warehouse inventory dashboard

Let your warehouse leads see stock, space and labour in one view instead of chasing numbers across systems.

  • Real-Time Inventory Levels by SKU & Location
  • Order Picking Accuracy & Fulfilment Speed
  • Storage Utilisation & Slotting Efficiency
  • Labour Productivity by Shift
  • Stockout & Overstock Alerts
Get Started
Mining site performance dashboard

Give your site workers and managers a role specific view of extraction, equipment and compliance across every location.

  • Extraction Volume & Grade by Site
  • Equipment Utilisation & Maintenance Schedules
  • Fuel, Energy & Consumables Cost per Tonne
  • Haulage Cycle Times & Fleet Efficiency
Get Started

TESTIMONIALS

What Our clients Say

Trusted by enterprises across the UAE and beyond.

We cut our reporting time by 60% in the first month. What used to take my team days now updates automatically every morning.
Mathew Tharakan
Managing Director, Emvees
Our board presentations used to take 3 days to prepare. Now I pull up the dashboard and we're ready in 20 minutes.
Venugopal P T
Managing Partner, Buchprufer LLP

ENTERPRISE SECURITY

Your Data Never Leaves Your Control.

We understand that handing a third party access to your financial, operational,
and HR data requires trust. Here’s exactly how we protect it.

End-to-End
Encryption

All data in transit and at rest is AES-256 encrypted. Always.

Your Cloud,
Your Control

We build within your existing Microsoft or Tableau environment, no third-party data transfer.

NDA on Day One

Every engagement begins with a signed mutual NDA before a single data connection is made.

Role-Based Access

Granular permission layers ensure each person sees only what they're authorised to see.

Make your data easier to see.

Your answers are already in your data. They’re just buried across  spreadsheets that don’t talk to each other. We bring them into a single view your team can act on.  

FAQ

Questions Smart Buyers Ask Us

We create clear, interactive dashboards and visualizations that turn complex data into actionable insights. 

Our data visualization consulting helps you choose the right visuals, improve dashboard usability, and communicate insights more effectively. 

Yes. We can connect and visualize data from spreadsheets, databases, business tools, and other common data sources. 

Absolutely. We design dashboards around your goals, metrics, workflows, and specific reporting needs. 

Every metric is reconciled against source systems and formally signed off with your team prior to handover. All definitions are documented, ensuring consistency across departments and reporting views. 

Assistance hours:
Monday – Friday 9 am to 6 pm

Contact info

Committed to support you, always!

Insights

Blogs

Assistance hours:
Monday – Friday 9 am to 6 pm

Office Number 53 , 13thFloor , Burjuman Business Tower, Al Mankool

1st Floor, Carnival Infopark Phase1, Kakkanad, Kochi, Kerala
Kochi Kerala 682030

 © Copyright Difinity Digital. All Rights Reserved

top

Talk to Our Experts

Let’s Solve Your Business Challenges.

We’ll tell you honestly where we can help, what it would take, and where we’d start.

350+

Successful projects delivered

110+

Service delivery experts

ISO Certification and GDPR Compliance

ISO 27001 certified GDPR compliant
Your Details

Share your details and our team will reach out within one business day.

Prefer to talk now? Call +91 9995099503

Talk to Our Experts

Let’s Solve Your Business Challenges.

We’ll tell you honestly where we can help, what it would take, and where we’d start.

350+

Successful projects delivered

110+

Service delivery experts

ISO Certification and GDPR Compliance

ISO 27001 certified GDPR compliant
Your Details

Share your details and our team will reach out within one business day.

Prefer to talk now? Call +971 04 259 7982

Simplifying IT
for a complex world.
Platform partnerships
Services
Business Challenges

Digital Transformation

Security

Automation

Gaining Efficiency

Industry Focus